Ultrasonic inspection of thick-walled objects using sparse antenna arrays
In the practice of ultrasonic testing, there are objects whose thickness is more than 200 mm or objects whose control is carried out on rays repeatedly reflected from its boundaries. Such objects include reactor vessels of nuclear power plants, main shut-off valves (GPP), welded joints of rotors, tees of gas pipelines, etc. The reconstruction of images of reflectors with high resolution in the main and additional planes and with a low noise level is a non-trivial task. To solve it with the help of phased array technology, antenna arrays with more than 128 elements and corresponding multi-channel equipment for emitting and receiving echo signals providing dynamic depth focusing (DDF) are required [1]. But even in this case, the transverse resolution in the main plane and, even more so, the transverse resolution in the additional plane may not be high enough.
To obtain a high-quality image of reflectors for recording echo signals, you can use a thinned antenna array (PRAR), which scans over the entire surface of the control object [Fig. 1]. PRAR refers to an antenna array with individual prisms for each element, between which the distance is much greater than the wavelength [2] (Fig. 3). The image of the reflectors from the measured echo signals can be restored using the SAFT method in a three-dimensional version [3], [4], [5]. The report shows the results of monitoring using this approach.
Description of the control object
Figure 1 shows a control object with a thickness of 297 mm made of stainless steel with an austenitic X-shaped welded joint, along the edges of which 8 numbered lateral cylindrical holes (BCO) with a diameter of 6 mm are drilled. The contours of the welded joint are schematically shown by a yellow polygon. The speed of sound in stainless steel is 5.714 ±0.03 mm/ms.

Fig. 1. View of the object of control. The y axis is directed perpendicular to the plane of the drawing
Fig. 2 shows a view of the object of control from the side of the BCO with a diameter of 2 mm. On the same side, in the center of the welded joint, 7 BTS with a diameter of 6 mm are drilled, which are numbered from 1 to 7c.

Fig. 2. View of the object of control from the side of the BCO with a diameter of 2 mm
Type of PRA used
Echo signals were recorded using a PRAR of type 6L1.8H30H45 with an operating frequency of 1.8 MHz with six elements with a distance between elements δx ≈ 6 <!-- [if gte mso 9]> <!-- [if gte mso 9]> mm.The dimensions of the element are equal to Δx = 4 mm and Δy = 8 mm.Note that in the case of an unlimited aperture, the frontal resolution in the main (xz) and in the additional plane (yz) will not depend on the depth and will be equal to the size of the piezoelectric element. Schematically, the PRAR design is shown in Fig. 3. The first three elements are designed to emit a longitudinal wave at an angle of 30 degrees, and from the fourth to the sixth – to emit a longitudinal wave at an angle of 45 degrees.
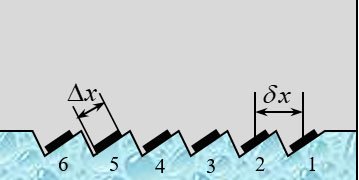

Fig. 3. Sketch of a six-element PRAR and a scheme for monitoring an object with a thickness of 300 mm. The y axis is directed perpendicular to the plane of the drawing
The PRAR was moved 597 times in 0.486 mm increments along the x axis, and 48 times in 1.5 mm increments along the y axis. Echo signals were measured when emitted by the first PRAR element and received by six elements (the first shot) and emitted by the sixth PRAR element and received by six elements (the sixth shot).
Restored Images
In this section, B-type images are combined into a matrix for easier viewing by highlighting the maximum value of the image along the y axis. The contrast of the images is increased by 9 dB to emphasize low-amplitude glare.
2D image, only the first PRAR element works
Figure 4 shows a 2D image of B-, C- and D-type and a slice of the image along the y axis, reconstructed from the echo signals emitted and received by the first PRAR element, which is equivalent to using a single-element converter operating in combined mode. The left border of the welded joint is visible. The high level of reverberation noise does not allow to detect the glare of BCO 1, 2 and 3 and the glare of BCO 1c and 2c located in the upper part of the welded joint. The high noise level in the welded joint does not allow detecting the glare of the BCO 7c and the glare of the BCO Ø2mm. Just below the glare of the BCO 4c, a false glare is clearly visible, formed by echo signals re-reflected from the boundary of the welded joint and the BCO 4c. Thus, 8 of the 16 BCOS drilled in the sample were detected.

Fig. 4. 2D image of reflectors when working with only the first element
2D image, first and sixth shots
Figure 5 shows a 2D B-, C- and D-type image and a slice of the image along the y axis. In comparison with the image in Fig. 4, the level of reverberation noise has decreased by more than 9 dB, and the noise level in the welded joint is more than 3 dB. The left border of the welded joint is clearly visible. The BCO 2 block is not visible, since the pulse travels the maximum distance along the welded joint. If the pair is monitored when it is placed to the right of the welded joint, then the BCO 2 unit is confidently detected. The glare of BSO 3 and BSO 7c is faintly noticeable. Of the 16 BCOS drilled in the sample, 12 were confidently detected. The false glare, which is marked in Fig. 4, has practically disappeared, which is due to the effect of using PRAR when the echoes of the shot are recorded. And the greater the distance between the first and last elements of the pairs, the more false glare is suppressed.

Fig. 5. 2D image of the reflectors on the first and sixth shots
3D image, first and sixth shots
Figure 5 shows a 2D B-, C- and D-type image and a slice of the image along the y axis. In comparison with the image in Fig. 5, the level of reverberation noise decreased by more than 6 dB. BCO 2 still could not be detected, but the glare of BCO 7c and BCO Ø2mm became more noticeable.The frontal resolution in the additional plane has increased in comparison with the 2D image, which is especially noticeable on the image slice along the y axis. Of the 16 BCOS drilled in the sample, 15 were definitely detected.

Fig. 6. 3D image of the reflectors by the first and sixth shot
3D image of a BCO with a diameter of 2 mm
Fig. 7 shows a fragment of the 3D image in Fig. 6 for a more detailed analysis of the glare of the BCO Ø2 mm.Not only the glare on the straight longitudinal wave (LdL) is clearly visible, but the glare is also clearly visible according to the LLdL acoustic scheme (the radiated longitudinal wave reflected from the bottom, reflected from the BCO and was registered as a longitudinal wave) and according to the LTdL acoustic scheme (the radiated longitudinal wave, when reflected from the bottom, transformed into a transverse one, reflected from BCO and was registered as a longitudinal wave). The presence of these three blocks allows you to confidently detect a BCO with a diameter of 2 mm.

Fig. 7. A fragment of a 3D image with a BCO Ø2mm
Conclusion
Thus, the following conclusions can be drawn from the results of the research presented in this note.
- To control thick-walled products with a thickness of more than 100 mm, it is advisable to use a PAIR of six or eight elements that are scanned over the surface of the object of control. During one-sided inspection of a weld sample made of austenitic materials and 3D processing of echo signals from 16 BO, 15 were confidently detected (see Fig. 6).
- The BCO block 2 could not be detected during the inspection to the left of the seam. But when monitoring to the right of the welded joint, the BCO 2 block is confidently detected. It is possible that when using two PAIRS placed to the left and right of the welded joint, it will be possible to detect this BCO.
- The glare of the BCO with a diameter of 2 mm is clearly visible (see Fig. 6 and Fig. 7).
- The analysis of the glare of the BO 1c when scanning the PRR to the left and right of the welded joint indicates the presence of a noticeable anisotropy in the welded joint. Taking it into account will improve the image quality [1].
--
[1]. Braconnier D., Okuda S., Dao G. A Detailed Study of Inspecting Thick Parts Using Large Aperture Phased Arrays and DDF, URL: https://www.ndt.net/article/jrc-nde2009/papers/94.pdf (accessed: 27.09.2020).
[2]. Bazulin E.G., Kokolev S.A. Increasing the signal-to-noise ratio during ultrasonic inspection of repair welding using the technology of thinned antenna arrays // Flaw detection. 2013. No. 5. pp. 45-58.
[3]. Bolotina I., Dennis M., Mohr F., Kröning M., Reddy K.M., Zhantlessov Y. 3D Ultrasonic Imaging by Cone Scans and Acoustic Antennas // 18th World Conference on Nondestructive Testing, 16-20 April 2012, Durban, South Africa.
[4]. Dolmatov D.O., Sednev D.A., Bulavinov A.N., Pinchuk R.V. Application of the frequency domain calculation algorithm in ultrasound tomography using matrix phased antenna arrays and compensation of the non-parallelism of the surface of the object of control relative to the scanning plane // Flaw detection. 2019. No. 7. pp. 12-19.
[5]. Bazulin E.G. Ultrasonic control on a single reflected beam using thinned antenna arrays and three-dimensional processing of echo signals // Flaw detection. 2016. No. 1. pp. 4-17.
[6]. Bazulin E.G. Consideration of anisotropic properties of a welded joint when reconstructing the image of reflectors from echo signals measured by an ultrasonic antenna array // Flaw detection. 2017. No. 1. pp. 11-25.