Control of a sample made of bronze BrX0.8 with a thickness of 100 mm
- the use of PWI technology to increase the energy injected into the sample (!!!) [3],
- combining multiple partial images using a coherent factor, and not as a coherent sum [4],
- reducing the pulse duration [5] through the use of super-resolution methods (the maximum entropy method (ME) and the method of compressive sensing (CS) [6, 7]).
A general view of the sample with two lateral cylindrical holes (BCO) with a diameter of 6 mm, shot at depths of 30 and 50 mm from the "bottom" side, is shown in the figure below.
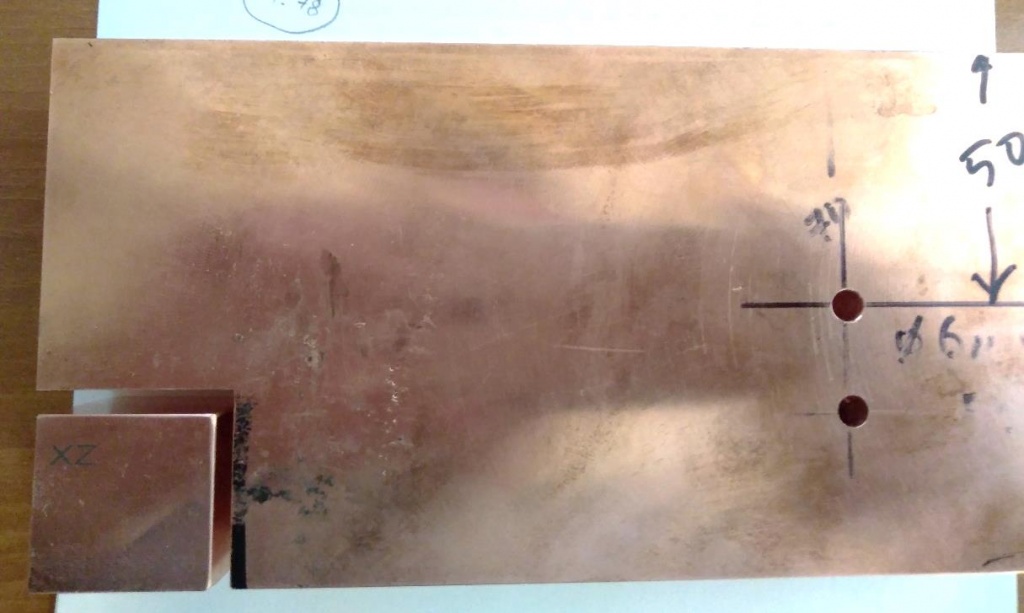
Figure 1. Bronze sample
To assess the acoustic properties of the sample, a fragment in the form of a cube with edges about 30 mm in size was cut out of it, as shown in Fig. 2.
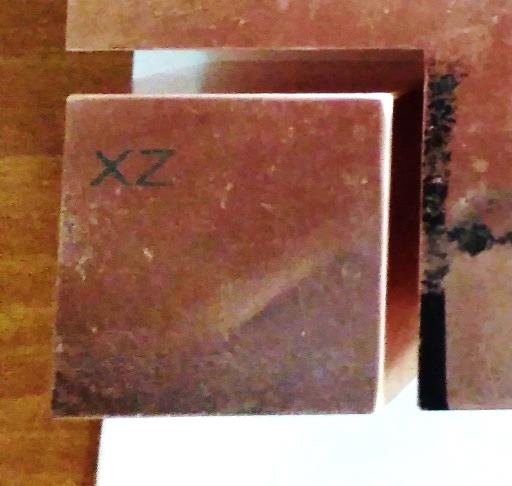
Figure 2. Sample fragment for studying its acoustic properties
Estimation of the longitudinal wave velocity
Using a conventional thickness gauge using a 4 MHz converter, it was possible to measure the velocity of the longitudinal wave along the x and y axes. Along the z axis, the thickness gauge could not stabilize the readings at maximum sensitivity. The measurement results are shown in the table below.
Using the software of the Augur ART system using a conventional 1.8 MHz piezo converter, it was possible to measure the speed of sound along all three axes. The results are summarized in the table below.
| Speed, mm/mks | |
| x | 5.00 |
| y | 4.93 |
| z |
4.58 или 5.00 |
| Speed, mm/mks | |
| x | 4.91 |
| y | 4.90 |
| z | 4.60 |
The behavior of the longitudinal wave velocity in three directions suggests that the sample most likely has a transversally isotropic anisotropy.
Anisotropy estimation
Five coefficients [8], by which six elasticity coefficients for transversally symmetry can be calculated, were determined as follows. The AR on the prism was scanned along the surface of the sample (triple scan mode or CFA-X [9]). Knowing the coordinates of the reflector, BTS images were restored for all sets of coefficients. Those coefficients at which the CFA-X image was obtained, focused in the right place, and relied on the answer to the question about the parameters of anisotropy. The figure below shows graphs of the dependence of group velocities on the group angle for three types of waves in the xz plane. The graph for the longitudinal wave is shown in green in Fig. 3, and in red and lilac for transverse waves of two polarizations.
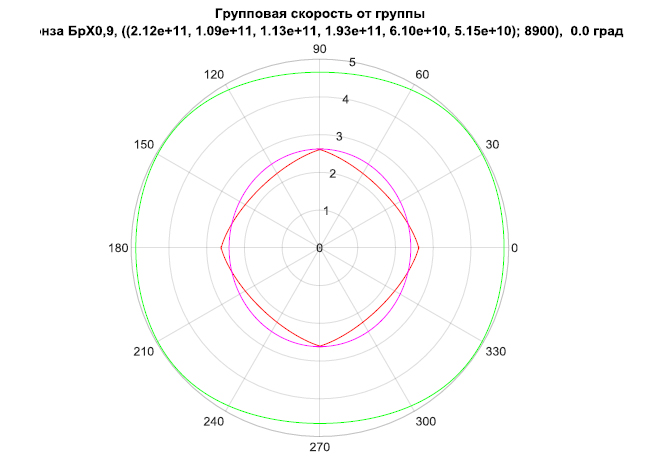
Figure 3. Graphs of group velocities
Thus, when restoring images, it was assumed that the elasticity coefficients are equal (212.0, 109.0, 113.0, 193.0, 61.0, 51.5) GP, the density is 8600 kg / m3, the angle of rotation of the crystal axes in the xz plane was assumed to be 0.0 degrees.
To register echo signals, an AR (2.25 MHz, 20 elements, the size of the piezoelectric element 1.1 × 10 mm, the gap between the piezoelectric elements 0.1 mm) mounted on a plexiglass prism with an angle of inclination of 20 degrees was used. The echo signals were measured in the triple scan mode or CFA-X, when the AP moved along the x axis 70 times in 1 mm increments over the sample surface. Figure 4 shows a photo of the sample when measuring echo signals.
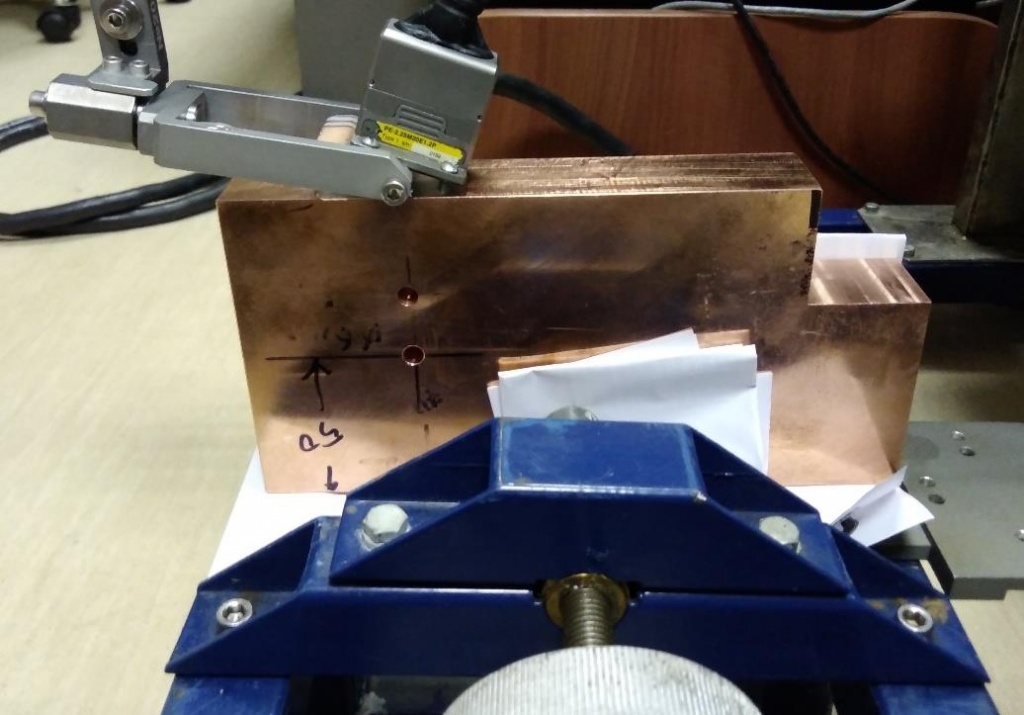
Figure 4. Sample when measuring echo signals
The signal-to-noise ratio was determined as follows: the maximum amplitude of the Imax glare was located on the selected image fragment, the glare of the reflector was removed at a given level, after which the average value of the image module M was determined. The signal-to-noise ratio was determined by the formula
Such an assessment of the signal-to-noise ratio can be applied when the noise level is small enough, for example, less than -6 dB.
BCO with a diameter of 6 mm at a depth of 30 and 50 mm
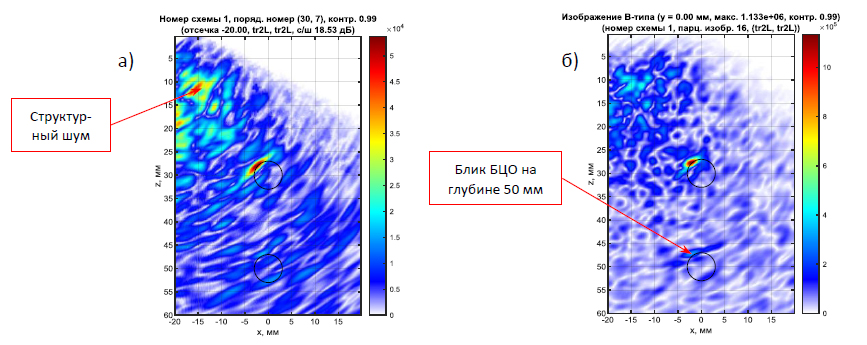
Figure 5a shows a partial longitudinal wave image (LdL acoustic scheme) for one position of the antenna array. It can be seen that a very high level of structural noise and glare of the reflector cannot be detected in the image at a depth of 50 m, and Fig. 5b shows a coherent sum of images for all positions of the antenna array. Despite the fact that simple summation of partial images is not the optimal way to reduce the level of structural noise, in Figure 5b, the level of structural noise decreased by at least 9 dB, and the glare of the BCO at a depth of 50 mm became noticeable. In the drawings, the contours of the BCO are drawn in black circles.
Figure 5. One partial image (a) and the coherent sum of all partial images (b) when combining multiple images as a coherent sum
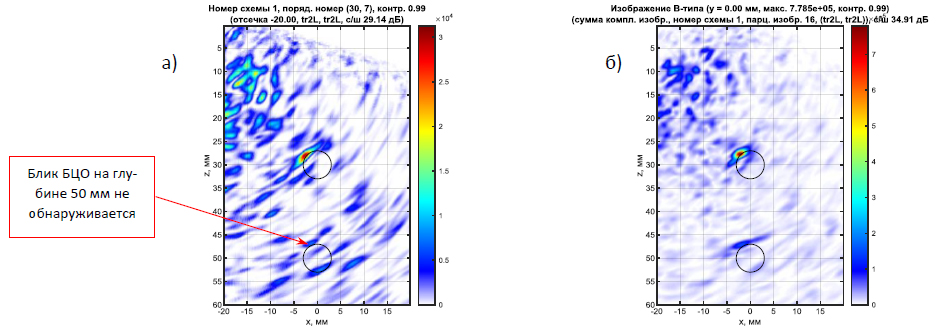
Figure 6. One partial image (a) and the coherent sum of all partial images (b) when combining multiple images taking into account the coherent factor
Fig. 7a shows the image of the BCO at a depth of 50 mm, reconstructed from the measured echo signals with the combination of partial images according to the formulas as a coherent sum, and Fig. 7b using a coherent factor. In fact, these are fragments of the images in Fig. 5b and Fig. 6b. Fig. 7b shows the ME image, that is, reconstructed from echo signals after the ME method, combined using a coherent factor. The beam resolution of the image has increased approximately twice as compared to Fig. 7b, the noise level has decreased by about 1.5 dB. In Fig. 7g shows an image reconstructed from CS echoes and combined using a coherent factor. The beam resolution of the CS image has increased approximately twice as compared to the ME image, and the noise level has decreased by 1.5 dB. Comparing the CS image (Fig. 7g) and the usual CFA image (Fig. 7a), it can be argued that it was possible to increase the beam resolution by about three times, and reduce the level of structural noise by about 13 dB.
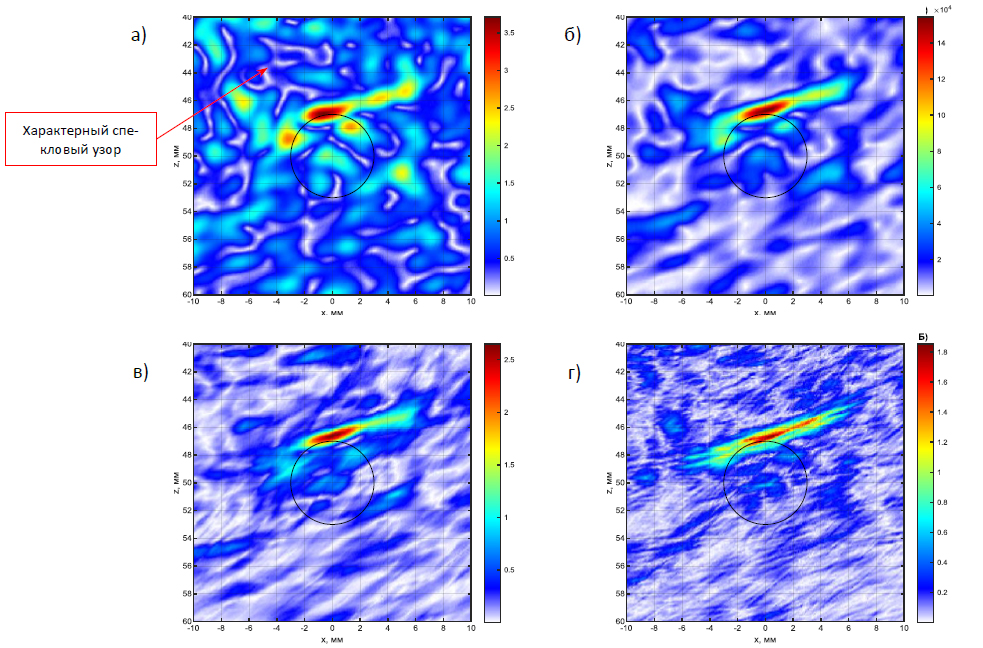
Figure 7. The image of the BCO at a depth of 50 mm, reconstructed from the original echo signals when combined as a coherent sum (a) and using a coherent factor (b), from ME echo signals (c), from CS echo signals (d)
Echo signals were measured using an AR (5 MHz, 64 elements, the size of the piezoelectric element 0.5 × 10 mm, the gap between the piezoelectric elements 0.1 mm) mounted on a rexolite prism with an angle of 17 degrees. The AP moved along the x axis 70 times with a step of 0.9884 mm. The echo signals were measured in FM and PWI modes in the hope of detecting the bottom of the sample at a depth of 100 mm.
BCO with a diameter of 6 mm at a depth of 30 mm
Figure 8 shows the image of the BCC at a depth of 30 m when combining the firing images as a coherent sum (a) and using a coherent factor (b). The images for different positions of the AP were coherently added. Combining the enhancement images using a coherent factor increased the signal-to-noise ratio by more than 12 dB

Figure 8. The image of the BCC at a depth of 30 m when combining the firing images as a coherent sum (a) and using a coherent factor (b)
It was not possible to detect the glare of the BCO border at a depth of 50 m!
Bottom
Figure 9 shows the image of the sample bottom at a depth of 100 mm when combining the firing images recovered from the echo signals measured in PWI mode as a coherent sum (a) and using a coherent factor (b). The images for different positions of the AR were coherently added. Plane waves were taken into account in the range from -10 to 10 degrees in increments of 1 degree. The result is ambiguous. Can we assume that a bottom flare has been detected? Or we observe a structural noise that has become suspiciously similar to the glare of the sample bottom! Or the structural noise is very heterogeneous in the volume of the sample and the detection of a fragment of the bottom glare is a consequence of the fact that the level of structural noise has decreased above it. This is a matter of further study.

Figure 9. Image of the bottom of the sample at a depth of 100 mm when combining multiple images as a coherent sum (a) and using a coherent factor (b) (PWI mode)
Conclusions
-
The use of a coherent factor when combining partial firing images increases the signal-to-noise ratio by more than 9 dB.
- Measuring the velocity of the longitudinal wave in the cube made it possible to clarify the type of symmetry and the values of elastic coefficients.
- Taking into account the transversally isotropic properties of bronze makes it possible to increase the signal-to-noise ratio and restore the glare of the boundaries of the reflectors in the right places.
- PWI technology has not proved to be an effective means to reduce the level of structural noise, which is not surprising, since by pumping more energy into the sample, it will not be possible to reduce the level of structural noise
Literature
-
Report on the use of devices A1212M, A1214E, UK1401, A1220M during the examination of the Tsar Bell of the Trinity-Sergius Lavra, https://acsys.ru/otchet-o-primenenii-priborov-a1212m-a1214e-uk1401-a1220m-pri-obsledovanii-czar-kolo
-
Kachanov V.K., Sokolov I.V., Kartashev V.G., Shalimova E.V. Application of special algorithms for spatiotemporal signal processing during ultrasonic inspection of large antique castings // Flaw detection. 2018. No.5. pp. 3-16.
-
Bazulin E.G., Evseev I.V. Application of Plane Wave Imaging technology in ultrasonic non-destructive testing // Flaw detection. 2021. No. 6. pp. 16-25.
-
Bazulin E.G. Ultrasonic control of the narrowness of two samples of polyethylene pipes using PWI technology, https://defektoskopist.ru/attachment.php?attach-mentid=24000&amp ;d=1644090888
-
Ermolov I.N. On the choice of optimal parameters of the echo method of ultrasonic defectoscopy // Flaw detection. 1965. No. 6. pp. 51-61.
-
Bazulin E. The maximum entropy method in ultrasonic non-destructive testing – increasing the resolu-tion, image noise reduction and echo acquisition rate // Entropy 2018, 20(8), 621; DOI: https://doi.org/10.3390/e20080621
-
Foucart S., Rauhut H. A mathematical introduction to compressive sensing, Basel, Birkhauser, 2013, 585 p.
-
Fedorov F.I. Theory of elastic waves in crystals. M.: Nauka. Glav. ed. phys.-mat. lit., 1965. 388 p.
-
Bazulin E.G. Image reconstruction of reflectors by the C-SAFT method taking into account the anisotropy of the material of the object of control // Flaw detection. 2015. No. 4. pp. 42-52.
File: pdf / 1.44 MB
Language: Russian Контроль образца из бронзы БрХ0,8 DOWNLOAD
